


?")


 DOMINATES PRESALE MARKET, WHILE BTC’S $52K HIGH IGNITES SHIB EXODUS")

, Cardano, and Dogecoin Analyst predict Kelexo to make big gains")


 as It Looks to 20X Investors Capital")
 presale obtains continuous investment from DOGE & Ethereum holders")
 Disturbs XOK & Binance as More BTC & SOL investors Buy Presale")

- The Verizon stock has been sued by the investors: what is the reason and how will the market react?
- The company is generating inconsistent sales; is it worth buying?
- The price has been falling for quite a long time, with no support in recent times.
About Verizon Stock Communications
Verizon Stock Communications Inc., an NYSE-listed company founded in 1983 and headquartered in New York, US, is a prominent multinational firm offering voice, data, and video services and solutions on its platform.
The company, under the leadership of CEO H. Vestberg, has achieved a commendable revenue of $136 billion. Verizon Communications Inc. boasts several subsidiaries, including TracFone Wireless, Visible, and Verizon Fios, among others.
However, the company has experienced inconsistent sales in recent years, leading to downtrends and consolidations in its stock price. Despite this, investors find the stock appealing due to its high dividend yield of approximately 7.7%.
The Metrics have been calculated as per financial statements provided by macrotrends.net
Why Are Investors Suing the Company?
Currently, news is floating in the market about Verizon being sued by its investors who are claiming that the company has violated the laws of the US by not disclosing the health and environmental consequences that could be attached to the lead cables it owns
VZ Stock Previous Price Action and Forecasting
Starting from May 2021, the price of VZ began a downward trend. In December 2023, the stock formed a support level, which unfortunately got broken in July 2023. Since then, the stock has been in a downtrend.
Notably, during this downtrend, the 50 EMA never crossed the 200 EMA in any of the recent months. This lack of crossover between the two EMAs suggests a prolonged period of bearish sentiment and reinforces the ongoing downtrend.
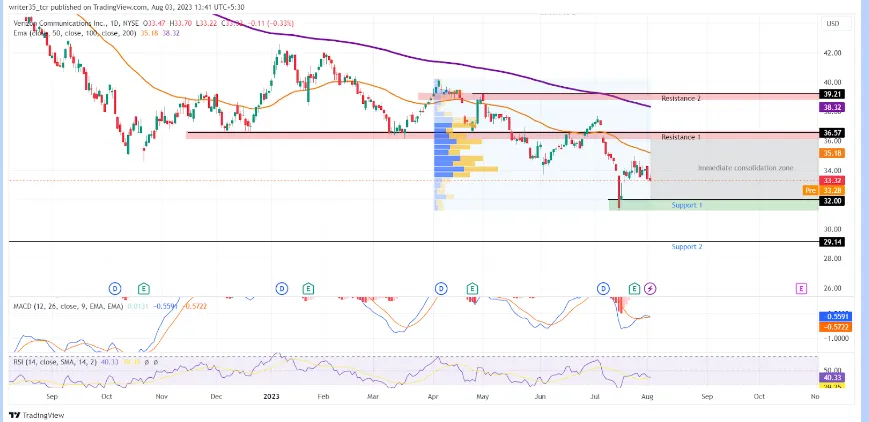
Currently, the stock of VZ has just broken its support of $34 and is currently consolidating between its immediate support and resistance.
VZ‘s Current Price Action
According to the analysis, the stock currently faces weak immediate support levels, with no confirmation seen within the past 10 years. The immediate support is observed at $32.
The second support level is based on historical data from 2010, with a value of $29.4. Given the extended time frame, this level may also hold some psychological significance, potentially acting as a support for around $30.
On the resistance side, there are two levels to consider. The first resistance (R1) stands at $36, and the second resistance (R2) is at $39. Both resistance levels have substantial volume levels, making them more likely to act as significant barriers for the stock’s price movement.
Indicators
MACD
The signal line crossing below the MACD line indicates a short upward trend, though the difference is relatively small (less than 0.02) due to consolidation at higher levels.
RSI
The RSI has been declining since July 23, starting at a level of 64 and currently standing at 39 points. This indicates a lack of strength in the current price movement. If the RSI continues towards 30, a potential spike in the price may be seen.
EMAs
The 50 EMA is currently at $35.18, indicating a downtrend as it is above the current price. The 200 EMA is at $38.32, and the gap between the two suggests no signs of a trend reversal at this point.
Market Prediction
The prediction for the stock’s price movement depends on the news circulating in the market. Pricing may react to the news and potentially break the immediate support. If this occurs, heavy selling could be observed. On the other hand, if the market sentiment improves, the price may move towards strong resistance levels.
Conclusion
Verizon, a listed firm on NYSE, specializes in providing voice, data, and video services and solutions. However, the company is currently facing legal challenges, as investors have sued the company for health and safety reasons.
From a technical perspective, the stock’s price has been continuously declining, indicating a persistent downtrend. Unfortunately, there are no nearby support levels visible to potentially reverse or stabilize the current downtrend.
Technical levels
- Support: $32, $29.4
- Resistance: $36.5, $39.2
RSI: 40
200 EMA: $38
50 EMA: $35
 Stock Forecast: It will go bearish till the Support")
: Price Surges Amid Positive Earnings")
