


?")


 DOMINATES PRESALE MARKET, WHILE BTC’S $52K HIGH IGNITES SHIB EXODUS")

, Cardano, and Dogecoin Analyst predict Kelexo to make big gains")


 as It Looks to 20X Investors Capital")
 presale obtains continuous investment from DOGE & Ethereum holders")
 Disturbs XOK & Binance as More BTC & SOL investors Buy Presale")

- Amazon stock price has sat above the 20, 50, and 200- days Exponential Moving Average.
- Amazon’s stock price is currently trading at $127.90.
- Amazon (AMZN)’s live market cap is $1.31 TRILLION.
Founded in 1994 by Jeff Bezos, Amazon.com, Inc., or Amazon, is a multinational technology and retail corporation. It began as an online book marketplace but quickly diversified to include various consumer items, electronics, apparel, and more.
E-commerce, cloud computing, digital streaming, and artificial intelligence are a few of the different business categories that Amazon operates in. The company’s e-commerce platform, which enables customers to buy things straight from Amazon’s website or mobile app, is its primary source of income.
Trend Analysis
A close inspection of the stock price of Amazon reveals that the current trend is showing strong upward momentum. Notably, the price rose sharply to a noteworthy high of $188.11 in November 2021, but then it fell and found support close to the $86 level.
Fortunately, the price made a notable turnaround from the mentioned support level in March 2023, accompanied by a spike in trading activity. An engulfing candlestick formation represented this bullish price action.
An appealing case for a rise is made when analyzing the overall structure seen on the price chart. The occurrence of the support level rebound, the development of the engulfing pattern, and the significant volume increase all imply that there is a strong possibility that the price will continue to rise. As the price moves closer to its prior high, it is crucial to remain alert to any potential pullbacks.
Amazon (AMZN) Stock Price Analysis
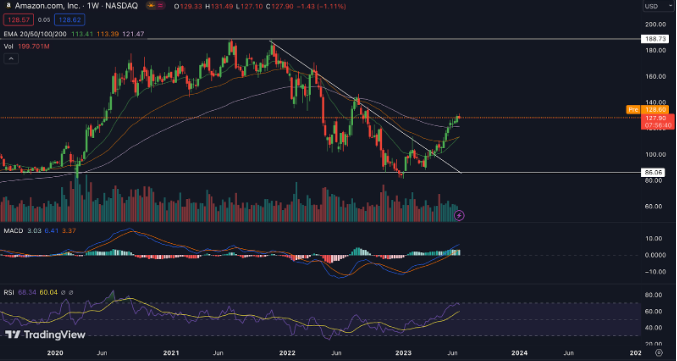
The 20, 50, and 100-day Exponential Moving Averages (EMA) for Amazon’s stock are below the price, a favorable indicator, and a potential indication of a price increase.
The MACD and signal lines are located above the zero line, generating a green histogram for the MACD indicator. This arrangement portends a potential market upturn.
Further evidence that there may still be an opportunity for price growth in the near term is provided by the fact that the Relative Strength Index (RSI) for Amazon has yet to cross into the overbought zone.
Conclusion
In conclusion, the current examination of the price of Amazon’s stock shows positive signs, anticipating more price growth in the near term.
When considering these elements, such as the favorable EMA placement, the bullish MACD configuration, and the lack of overbought circumstances in the RSI, there is a strong indication of a good prognosis for Amazon’s stock Price.
Technical Levels:
- Support – The current support level of Amazon (AMZN) is $14.9010.
- Resistance -The current resistance level of the Amazon (AMZN) is $19.0789.
Disclaimer
The views and opinions of the author, or anyone named in this article, are for informational purposes only. They do not offer financial, investment, or other advice. Investing or trading crypto assets involves the risk of financial loss.
