


: The Best Crypto Presale Captivating Investors")


 DOMINATES PRESALE MARKET, WHILE BTC’S $52K HIGH IGNITES SHIB EXODUS")


 as It Looks to 20X Investors Capital")
 presale obtains continuous investment from DOGE & Ethereum holders")
 Disturbs XOK & Binance as More BTC & SOL investors Buy Presale")

SAFEMOON had a rough start to the year as the price kept on struggling to sustain above the $0.000283 level. After multiple attempts, the bulls gave up which plummeted the price by 53.56%.
- SFM/USDT is down 4.52% in today’s trading session
- SFM/USDT is sinking down towards an important daily support of $0.000133
SFM/USDT is trading at $0.000177 after facing rejection at the daily support of $0.000283. The price is 30% below the daily 200 EMA. The current market structure suggests a strong downtrend with the probability of reaching the daily support of $0.000133. This is a fall of almost 25% from the current level.
The Daily chart shows the market structure of a downtrend
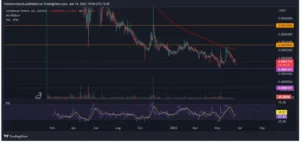
The Daily chart is showing that the digital asset is under the control of bears. The price recently saw a rejection from the 200 EMA and the mid-term resistance of $0.00283. Tension rises as the price slowly creeps toward the support. The Price must hold this support as a breakdown can cause a bloodbath in the market. This breakdown will force the market to bleed out by almost 94% which is very scary.
On the other side, some investors are waiting to buy at the support level. If the price manages to reverse from the support, It will be able to manage a recovery of almost 100%. This leg can also create a double bottom which is a trend reversal pattern. Such a scenario will increase the probability of further upside and could fetch massive gains for the investors who enter the market at the present time.
The 4H chart shows increased volatility
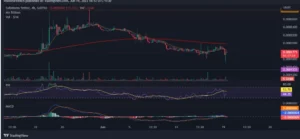
The 4H chart is showing the rejection of the price from the 4H 200 EMA signaling a sell pressure. The recent rejection caused the price to plunge by almost 21.80%. The price quickly bounced back making a bullish hammer pattern. The recovery was also about 15% and this indicates the highly volatile nature of this asset.
The Current market conditions are not favorable for investors who are inexperienced or carry a low-risk appetite. This overwhelming condition can cause a big dent in the portfolio. Hence it is advised to follow proper risk management or wait for ideal market conditions. The present market scenario holds the risk of a downside which can be a minimum of 24.50%.
RSI
The RSI indicator is currently at 44.25 and the RSI has crossed the MA line towards the downside. This is a sign of bearish to sideways market condition.
MACD
The MACD indicator is making a bearish crossover and this is a signal for a potential move toward the down.
200 EMA
As observed, on the 4hr, the price is trading below the 200 EMA(exponential moving average) which acts as a significant resistance. This is a clear indication of a downtrend where the sellers are in control and for a trend reversal, the price must break and trade above the 200 EMA.
Technical levels
Support Levels: $0.000133
Current Price: $0.000177
Resistance Levels: $0.000283 – Resistance 1
$0.000466 – Resistance 2
Conclusion
SAFEMOON is a highly volatile digital and is currently under selling pressure. The is getting slowly moving down towards its daily support level. This support is very important as a breakdown will create uncertainty and it will become difficult to predict the future of this asset. Recovery from the support has immense potential for big profits.


 Coin Price Prediction 2023")


