- Intel Stock Price is presently trading at $35.80 while witnessing a gain of 0.08% during the intraday session.
- The year-to-date return of INTC price is 32.37% and the three-month return is 16.84%.
- The INTC stock price achieved an annual high on Monday.
INTC stock price is currently trading above the 20, 50, 100, and 200-day EMA, indicating strength in the market Corporation is a US-based multinational firm that engages in the design, manufacture, and sales of computer products and technology. It is well known for its world-renowned semiconductor chip. It is also the developer of the 8086 microprocessor and its 8088 variant of the x86 series of instruction sets found by the name of intel i-series in most personal computers.
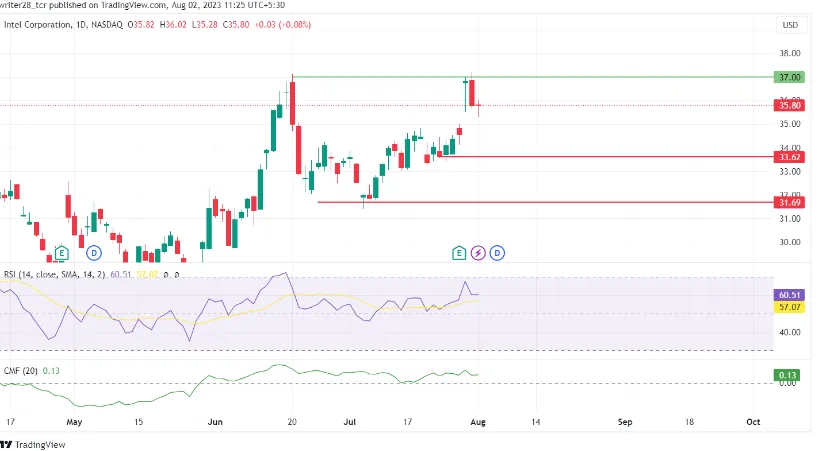
The current scenario of the INTC stock price indicates a bullish trend in the market. The recent release of the second quarter’s earnings and revenue data on July 27 shows the positive results influencing the recent spike in the INTC stock price action. The revenue estimate was $12.12 Billion, while the reported revenue is $12.94 Billion, resulting in roughly $0.82 Billion of positive growth. Furthermore, the consensus earnings estimate was -0.038 while the reported earnings are 0.13 with an inverted result of +0.16 growth.
This remarkable hike in the INTC stock price affected the dominance of bears in the market and achieved an annual high but was halted there with a resistance level of $37.19. Now, the Intel stock price is trading at $35.8 while witnessing the past 24-hour return of 0.08%. Upward momentum was observed in the market on a weekly and monthly basis, with a return of 6.23% and 7.32%, respectively.
With the recent development in the Artificial Intelligence (AI) sector, there is an underlying risk to the company’s outlook that shouldn’t be underestimated. It remains to be seen how the artificial intelligence trend is going to affect technology spending.
Bounce Back Of INTC stock price.
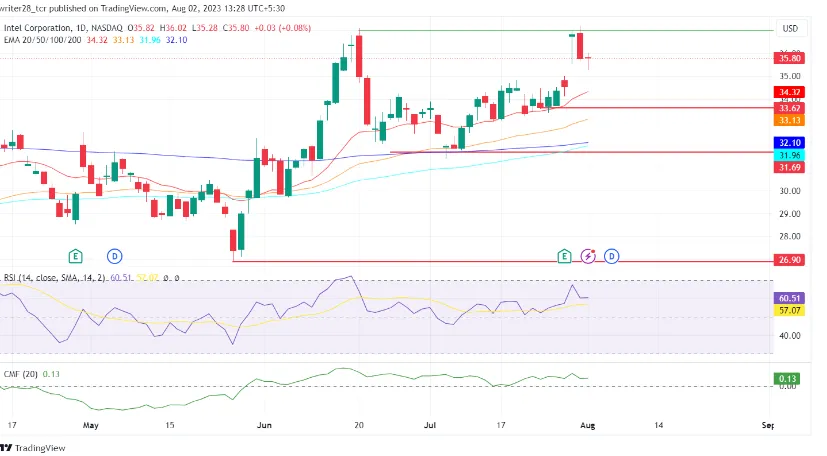
The INTC stock price is currently trading above the 20, 50, 100, and 200-day EMA, indicating strength in the market.
RSI trades at 60.51 points, denoting the rise in the participation of buyers in the market during the intraday session.
The Chaikin Money Flow score is 0.13 and represents the bullish momentum in the market in the past 24 hours. Although the CMF indicates strength, it is slightly losing bullish momentum, and there is a fear of a rise of bears in the market.
With an average volume of 46.39 Million shares, the market capitalization of INTC stock is $149.93 Billion.
Conclusion
The market structure indicates the dominance of bullish momentum in the market. After attaining an annual high on July 31, Intel’s stock price is poised to rise even higher. Investors should look for buying opportunities in the long run.
Technical levels
- Major support: $31.38 and $26.86
- Major resistance: $37.91 and $37.11


