


: The Best Crypto Presale Captivating Investors")


 DOMINATES PRESALE MARKET, WHILE BTC’S $52K HIGH IGNITES SHIB EXODUS")


 as It Looks to 20X Investors Capital")
 presale obtains continuous investment from DOGE & Ethereum holders")
 Disturbs XOK & Binance as More BTC & SOL investors Buy Presale")

- WMT Stock has grown 25.54% in one year.
- WMT Stock delivered a year-to-date performance of 8.23%
WMT Stock Price performed well in the month of June while following a long-term uptrend The Stock price grew almost 7% in this month. Walmart Inc. closed the trading session on Thursday at $154.28 with a drop of 0.68% over the previous day.
On June 29th, Alice Walton, who holds a 10% stake in Walmart, sold 2,149,275 shares for a whopping $330,918,650.
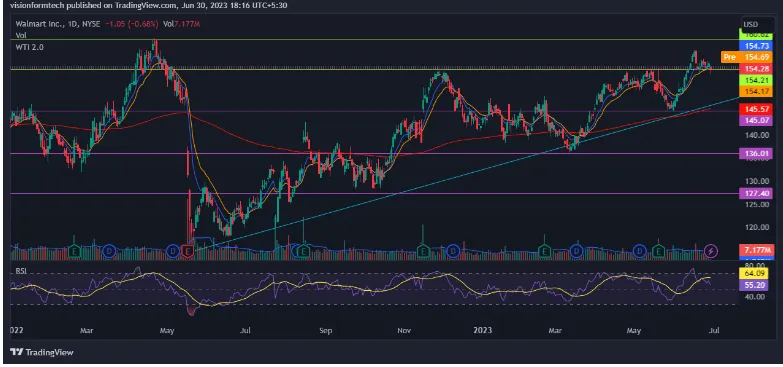
WMT Stock Price: A Strong uptrend
On the Daily chart, WMT appears to be in a strong uptrend. This Bullish trend can be traced back to May 2022. Prices kept rising while bouncing off a support trendline. The market saw a pull back 5.31% in May 2023 while June managed to fetch a return of almost 6%.
WMT Stock Price has created a higher high while getting closer to an all-time high of $160. The Current price action contributes to the probability that Walmart might break the all-time high and ascend to new heights. Yesterday’s trading session closed with a bullish pin bar formation. It may help the market to ascend further.
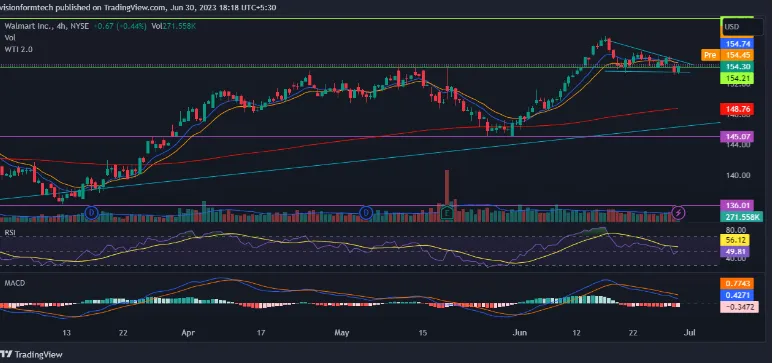
Potential Bull-Flag: Technical Indications!
According to the 4H, Price broke the resistance of $154.21 and The Bulls are fighting to sustain it. Meanwhile, the price appears to be forming a bull-flag structure. This pattern has a bullish price target of $166-$167. WMT looks strong and a new all-time high can be just a matter of time.
The technical indicators are showing strength as well. It is always wise to consider a dual scenario and react according to the price. If the market were to fall from here, the prices will take support at $150.
RSI:
The RSI indicator is currently at 49.81. It means the market may move sideways in the short term
MACD:
The MACD indicator made a bearish crossover above the 0 line. Histogram conveys the lack of momentum in selling and the market may move sideways
200 EMA:
As observed, on the 4hr, the price is trading above the 200 EMA(exponential moving average) which acts as a significant support. This is a clear indication of an uptrend where the buyers are in control and for a trend reversal, the price must break and trade below the 200 EMA.
Summary:
WMT Stock reversal. Investors can factor in fundamental reports along with technical analysis to make informed decisions.Price performed well in the month of June while following a long-term uptrend. Curiosity rises as the price approaches an all-time high. WMT Stock is highly bullish with no signs of a major
Technical levels
Support Levels: $150- Support 1
$145- Support 2
Current Price: $154.28
Resistance Levels: $158 – $160
Disclaimer
In this article, the views and opinions stated by the author, or any people named are for informational purposes only, and they don’t establish investment, financial, or any other advice. Trading or investing in cryptocurrency assets comes with a risk of financial loss.


 Coin Price Prediction 2023")


