ATOM prices are in turmoil as the bears keep unloading their bags. The digital asset lost almost 50% of its value since February. Atom is trading in a crucial demand zone where the bulls hope to kickstart the reversal.
- ATOM/USDT is up 2.25% as of today’s trading session
- ATOM/USDT saw a v-shape recovery of almost 24% from its recent dip
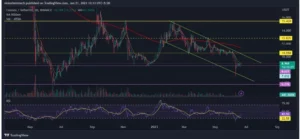
ATOM/USDT is trading at $8.96 after the market collapsed from its swing high at $15.42. The asset is in a downtrend for the past few months. The price saw a massive sell-off when it breached the $10 mark. This breakdown led to a scary dip of almost 35% where the price briefly managed to pierce through its important support of $8.62.
The Daily chart shows a strong downtrend.

As the Daily charts say, the bulls quickly showed up on the support level and the market displayed a V-shaped recovery of almost 25% which trapped the bears. Things got scary for a moment as a confirmed breakdown of this level could have triggered a market collapse of almost 30%. As of now the bulls still hold the support and this bounce is surely going to weaken the bears in the short term. The market is trading 20% below the 200 EMA
The price action shows the formation of a descending channel where the bears kept selling on the upper trendline. This channel can serve as a potential opportunity for the bulls who are looking to kickstart a reversal. The price will have to cross a very strong resistance which is the $10 price along with a powerful breakout above the channel.
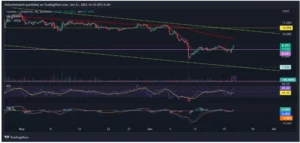
The 4H chart shows a strong bounce.

A closer look at the 4H chart shows that recovery from the support is changing the trend in a shorter time frame. The price managed to create a higher low and is continuing to rise. It is too early to say that a reversal is in progress as the price is still below the 4h 200 EMA.
According to technical analysis, the market is expected to consolidate for some time to cool things off from the recent volatility. As per the price action, a breakout of this channel can unlock the probability of at least a 50% move to targeting the $15 resistance. The trend remains bearish as of now.
RSI
The RSI indicator is currently at 63.03 on the 4H and the RSI has crossed the MA line towards the upside. This indicates strong bullish conditions.
MACD
The MACD indicator is making a bullish crossover and the indicator is about to cross the 0 line. This is a signal of bullish move
200 EMA
As observed, on the 4hr, the price is trading below the 200 EMA(exponential moving average) which acts as a significant resistance This is a clear indication of a downtrend where the sellers are in control and for a trend reversal, the price must break and trade above the 200 EMA.
Technical levels
Support Levels: $8.62 – Support 1
$5.77 – Support 2
Current Price: $8.96
Resistance Levels: $10.55 – Resistance 1
$12.83 – Resistance 2
Conclusion
ATOM Is under a bearish influence and the price is following a strong downtrend. A descending channel holds the key for a reversal. The price is expected to retest the resistance of $10. The bulls are closely observing the upper trendline of the channel for a breakout. The price is trading at key demand zones where investors can be lured into buying due to a big discount on the price and good upside potential. As the market is still bearish, investors are advised to have a solid plan to minimize risk while maintaining a good risk-to-reward ratio.


