


: The Best Crypto Presale Captivating Investors")


 DOMINATES PRESALE MARKET, WHILE BTC’S $52K HIGH IGNITES SHIB EXODUS")


 as It Looks to 20X Investors Capital")
 presale obtains continuous investment from DOGE & Ethereum holders")
 Disturbs XOK & Binance as More BTC & SOL investors Buy Presale")

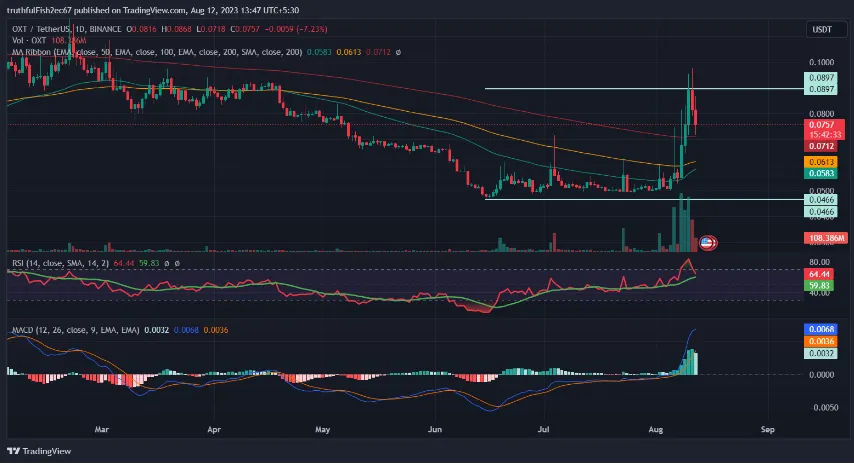
- Recently, the price has shown a strong bullish trend after increasing by more than 50% in one week.
- Currently, the price is trading above its 50, 100, and 200 EMA levels.
- It seems that buyers are leaving control of the market, hence there is a chance of a trend reversal.
OXTUSDT: End of a Bullish Trend
Orchid is a platform that supports a multi-hop VPN client, an onion routing network that is rewarded by OXT, and a decentralized market. The Orchid community is a supporter of Open Source software and thinks that Orchid can help create a more liberated, prosperous future.
Currently, the token is trading at 0.076 USDT, down by 7.4% on an intraday trade basis. Its total 24-hour traded volume stands at 247.42 Million. We can see in the above chart that after a long bearish trend, the currency has started to rebound and has been on a strong bullish trend this month as we have seen dominance from the buyers’ side. But now, it seems that there can be a decline in the price as it has started to take a rejection at its resistance level and the trading volumes have also declined.
By looking at the Bollinger Bands, the price has taken a rejection from its upper band and hence it is a signal for take-profit for the long position holders.
Exponential Moving Average (EMA) and Moving Average Convergence and Divergence (MACD)
By looking at the 50, 100, and 200 EMA levels in the chart, we can see that since the currency has taken a retracement from its 50 EMA levels, it has been on a high rise and has crossed all its EMA levels. Now we can observe that the currency is again nearing its 200 EMA levels and there is a possibility of a rejection and that can lead to a certain decline in the price. It may take a retracement at that level and enter into consolidation if the buyers try to become active again but that is less likely. However, the long-term outlook of the currency is not so good as its 50 EMA level is very low, and historically as well, it has been bearish.
After looking at the MACD(12 and 26) curve, there is a strong rise in the lines as the trading volume has increased. But, now the fast line may have a divergence which will cause a decline in the price.
Relative Strength Index (RSI)
Currently, the level of RSI stands at 63.43 and it has recently come out from the overbought zone, if there is a constant decline in the level of RSI, it will lead to a fall in the currency price.
Candlestick Pattern
If we look at the recent candles, then we can see a Tweezer top candle pattern and after that again a bearish candle is formed, which indicates a bearish behavior and a sell signal.
Conclusion
Overall, the currency has shown a good up trend in the market, but now after looking at all the indicators, there is a signal of a trend reversal and the currency may enter into a bearish trend. The upcoming sessions should see close attention paid to OXT by traders. The top is most certainly in place if sideways consolidation or a bearish reversal pattern is verified.
Technical Levels
- Resistance levels: 0.09 USDT
- Support level: 0.04 USDT
Recommended Strategy: Sell (Short)
- Stop-Loss: 0.09 USDT


