- Yearn Finance (YFI) is currently trading at $6498.81 with a rise of -1.78% in 24 hours.
- Yearn Finance (YFI)’s live market cap is $214,341,013.
- Yearn Finance (YFI)’s 24-hour volume of $16,975,079 rose by -32.47% in the last 24 hours.
A decentralized finance (DeFi) network based on the Ethereum blockchain is called Yearn Finance, commonly known as yearn.finance or YFI. It offers a variety of yield farming tactics and vaults with the goal of optimizing and automating yield generation in the DeFi ecosystem.
Andre Cronje, a notable person in the DeFi industry, founded Yearn Finance. The platform’s native token, YFI, is used for governance and enables holders to take part in choosing how the platform will be changed and upgraded.
Trend Analysis
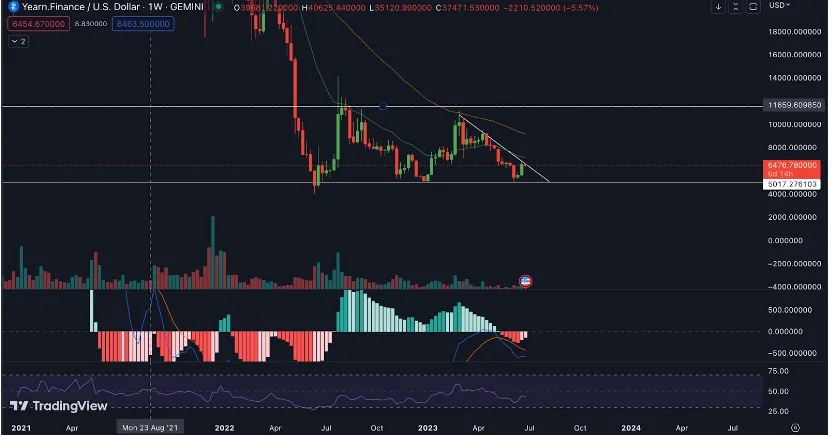
We could say that Yearn Finance (YFI) is currently in a downtrend based on last past price trend data. The price of Yearn Finance (YFI) has decreased by 65.4% over the last month, showing that it is now performing poorly. Yearn Finance (YFI) has decreased by -90.45% since reaching its high of $6.8824543 approximately one year ago. The price of YFI is currently moving in a range of $11659 to $5017and forming an ascending triangle pattern. We can expect the price to fall further shortly.
Yearn Finance (YFI) Price Analysis

EMA
The EMA determines an asset’s average price over a given time period, giving more weight to recent prices. Yearn Finance’s weekly period study reveals that Yearn Finance’s stock is regularly trading below the EMA, indicating a pessimistic attitude. The EMA’s falling slope suggests that the bearish trend may continue.
MACD
The MACD indicator is made up of two lines, the MACD (fast line) and the signal (slow line), as well as a histogram. When the MACD line crosses below the signal line, it indicates a likely negative trend. The MACD line has crossed below the signal line, indicating a possible move to negative momentum. The histogram is largely negative, indicating that the slump may continue.
RSI
The RSI indicator calculates the size of the most recent price fluctuations and sheds light on overbought or oversold market conditions. The RSI reading is under 50, which denotes bearish momentum. A potential continuation of the decline is indicated by the downward-sloping RSI.
Volume Analysis
The Yearn Finance (YFI) 24-hour trading volume is $16,975,079 with an increase of -32.47%, indicating a decrease in market activity. This will lead to a falling market scenario.
Technical Levels
- Support – The current support level of Yearn Finance (YFI) is $5017.276103
- Resistance -The current resistance level of Yearn Finance (YFI) is $11553.448182.
Conclusion
In conclusion, Yearn Finance (YFI) is now showing a bearish signal based on the weekly period technical indicators, despite the RSI showing the likelihood of an overbought scenario. According to the EMA analysis, the short-term trend is negative, and the price of Yearn Finance (YFI) indicates future uncertainty.
Disclaimer
The views and opinions expressed by the author, as well as those of anybody else mentioned in this piece, are only for informative reasons. They do not provide any financial, investing, or other advice. When buying or trading cryptocurrencies, there is a risk of financial loss.


