- ORCL Stock Price climbed 42% since the start of the year.
- ORCL Stock creates a fresh all-time high at $127.56
- Oracle Corporation is getting correction while maintaining its strong bullish sentiments
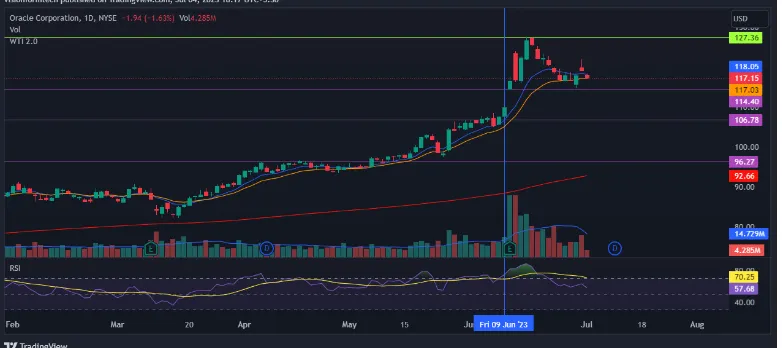
ORCL Stock Price made its investors very happy by delivering a year-to-date growth of 42% and reaching new heights. Oracle Corporation closed Monday’s trading session at 117.15 with a dip of 1.63% below the previous week.
Oracle Corporation added 40% to its shares as its earnings grew from the increased demand for Artificial intelligence from its clients. The stock sets a new milestone by setting a fresh all-time high in June.
ORCL Stock Price: A pullback from the all-time high.

Source: ORCL by TradingView: https://www.tradingview.com/x/UTgxGPjv/
The Daily chart depicts the bullish nature of ORCL Stock Price. The market broke its all-time high on 9th June and created a new one at $127.54. ORCL Has been trading in a strong uptrend since the start of the year. The stock price recorded year-to-date growth of 42%.
ORCL Stock Price is witnessing a correction and the market fell by 8% from an all-time high. Yesterday, the price managed to close above the 9 and 15 EMA. The price has local support of $114.40 and $106.78. The correction may bring down the prices to fill the gap. Investors should remain cautious.
Reduction in momentum and volume: Technical Indications

Source: ORCL by TradingView: https://www.tradingview.com/x/cYJ9nJf9
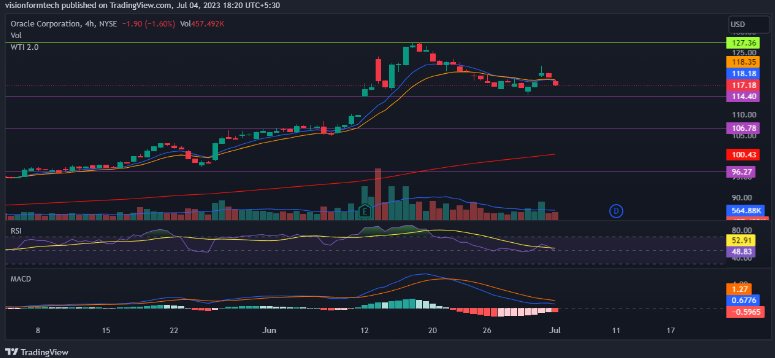
On the 4H, the momentum seems to be slowing down and the volume is diminishing. This may be a result of profit booking where investors want to take some profits home. The 9 and 15 EMAs are becoming flat. It means the market may consolidate in the short term.
ORCL Stock price stays bullish as long it floats above the 200 EMA. A break of the support may drag the prices to $106.78 which will be a 6.67% drop. If the prices move up without breaking support, They may break the all-time high. In such a case, the prices may reach $135 according to the Fibonacci retracement level of 1.618.
RSI: The RSI indicator is currently at 52.91. It means the market may move sideways in the short term
MACD: MACD made a bearish crossover above the 0 line. The red histogram is getting lighter which means sellers are losing momentum and the market may float sideways.
200 EMA: As observed, on the 4hr, the price is trading above the 200 EMA(exponential moving average) which acts as a significant support. This is a clear indication of an uptrend where the buyers are in control and for a trend reversal, the price must break and trade below the 200 EMA.
Summary:
ORCL Stock Price made its investors very happy by delivering a year-to-date growth of 42% and reaching new heights. The overall sentiments are bullish and prices may continue to rise. At present, the market is getting a correction but there are no signs of a trend reversal. Investors can consider support as buying levels but the market may be overbought. Therefore risk management should be a priority
Technical levels
Support Levels: $114.40 – Support 1
$106.78 – Support 2
Current Price: $117.15
Resistance Levels: $127.56
Disclaimer
In this article, the views and opinions stated by the author, or any people named are for informational purposes only, and they don’t establish investment, financial, or any other advice. Trading or investing in cryptocurrency or the stock market comes with a risk of financial loss


